Search
378 results for “sterndata”
-

Bei #solarpunk geht es doch explizit um die Nutzung neuer #Technologien auf dezentraler Ebene. Das schließt insbesondere auch #Städte und #Quartiere sowie kollektives Handeln (#genossenschaften fallen mir spontan ein) mit ein Und nicht nur die Ökozelle auf dem Land ;-)
@solarpunk -

Bei #solarpunk geht es doch explizit um die Nutzung neuer #Technologien auf dezentraler Ebene. Das schließt insbesondere auch #Städte und #Quartiere sowie kollektives Handeln (#genossenschaften fallen mir spontan ein) mit ein Und nicht nur die Ökozelle auf dem Land ;-)
@solarpunk -

Bei #solarpunk geht es doch explizit um die Nutzung neuer #Technologien auf dezentraler Ebene. Das schließt insbesondere auch #Städte und #Quartiere sowie kollektives Handeln (#genossenschaften fallen mir spontan ein) mit ein Und nicht nur die Ökozelle auf dem Land ;-)
@solarpunk -

Bei #solarpunk geht es doch explizit um die Nutzung neuer #Technologien auf dezentraler Ebene. Das schließt insbesondere auch #Städte und #Quartiere sowie kollektives Handeln (#genossenschaften fallen mir spontan ein) mit ein Und nicht nur die Ökozelle auf dem Land ;-)
@solarpunk -

um ethisch-moralische korrekt und humanistisch zu handeln brauche ich keine unsichtbaren ausgedachten Wesen die mich beobachten und bestrafen sondern nur meinen gesunden Menschenverstand.
sorry, ........
-

První štěňata labradora v Peskoslovensku pse nalabrodila 6. odčervence 1975 v chovatelské stanici „Z Pomolabraví" matce Julii z Palgrave a otci Sandylands Marcupsovi.
.
#matylda #labrador #labradosti #joybrador #labradorretriever #labradors #brownlabrador #blacklabrador #labradorlove #lovelabrador #labdogs #doglovers #labrador_lovers #blackbrador #lovebrador #51letodprocesusceskymundergroundem -

#Individualverkehr ist Alles was kein Öffentlicher Verkehr ist - also auch
- Zu fuß gehen
- Radfahren
- E-Scooter fahren
- Skateboard fahren
- Skater/Roller fahren
und natürlich... #Auto fahren was klassicherweise als #MIV bezeichnet wird auch wenn #E-Bike sich dem eigentlich schon recht nahe kommt.Individualverkehr wird immer existieren, denn auch der beste #ÖV #ÖPFV #ÖPNV kann niemals alle Routen effektiv abdecken.
Der Weg vom IV zum MIV ist recht kurz....
MIV ist kein grundlegendes Problem (und wie bereits erwähnt, sehr schwer loszuwerden) sondern vor allem seine extrem ineffiziente Ausgestaltung in Form des Autos.
Geht man vom Auto weg hin zu besseren Gewichtsverhältnissen, so muss auch der MIV den Umwelt und Klimavergleich zum ÖV nicht fürchten, denn der ÖV fährt systembedingt auch schon mit einen ganz ordentlichem Rucksack rum. (Durchschnittliche Auslastung, sekundäre Emissionen durch ÖV bedingte Nachteile)
So könnte MIV im urbanen Raum sein:
-

-

Day 3 of #30DayMapChallenge #polygons, which I used as a prompt to explore some of the free data available in Denmark, as well as the standard #QGIS plugins provided by #klimadatastyrelsen.
A map of eel grass habitat in #Copenhagen harbour in 2012. If you have access to more recent data, I'd love to have it!
Explanation: https://sternaparadisaea.net/30-day-map-challenge/ -

There's no way to call anyone at #Menards.com when they've made a mistake on an order. This is probably a deliberate addition of "sludge".
https://www.theatlantic.com/ideas/archive/2025/06/customer-service-sludge/683340/
-

#ESO:
"
„Große Überraschung“: Astronomen entdecken Planeten in senkrechter Umlaufbahn um ein Sternpaar
"
".. Planeten entdeckt, der in einem Winkel von 90 Grad um ein seltenes Paar besonderer Sterne kreist. .. das erste Mal .. einen eindeutigen Beweis für einen dieser „Planeten in polarer Umlaufbahn“ .."https://www.eso.org/public/germany/news/eso2508/?nolang
16.4.2025
#2M1510 #Astronomie #BraunerZwerg #Doppelsternsystem #Exoplanet #UVES #VLT
-

This post is in response to a thread posted on blue sky* by Jeremy Bassis and a discussion between Felicity mcCormack and Gavin Schmidt. All these people are well-respected climate scientists and the original thread was posted as a result of a Nature piece about operationalising climate models (and sea level rise), like we forecast the weather. This is something I’ve been thinking about for a while too, as sea level rise is an undeniable existential threat to my home country…
Anyway, I replied with a link to the Danish Climate Atlas – which to my mind is very much a model for how climate information should be done. I can’t give a full overview of the Climate Atlas, largely because it’s not my story to tell, but as Jeremy asked me to talk more in depth about it, and given the 300 character limit, I thought I’d formulate a few thoughts here first before sharing…
The climate atlas is not a book but a web frontpage that allows anyone with an internet connection to get high quality climate information at a local scale in Denmark. The map interface makes it easy and intuitive to use, and for detail a whole bunch of reports and datasets in different formats can be downloaded (everything from ASCII to GIS to netcdf). You can explore it here. All the data is given on a kommune (local authority) level except for sea level rise data which is divided up by coastal stretches.
Example of a Climate atlas figure – this is the overview figure, each local authority area is clickable for local informationFor audiences that just want a quick message there are these easy to interpret icons with a key message below, like this one about higher water levels.
I was involved in the early stages and to my mind there are 4 crucial elements that have made it very successful:
- Legal Requirement: Every local authority (a kommune, don’t think hippies, think regional councils) in Denmark has a legal obligation to make climate adaptation plans and to keep them updated. This element is important as it created awareness of the problem and effects of climate change and the necessity of investigating adaptation options. The initial plans were rather patchy and not very consistent with each other. Many regions had employed a consultant who was also maybe not an expert. Several kommune ended up with data based on CMIP resolution data! Hardly appropriate for a small local region in Denmark (which is barely resolved in most global climate models).
- Data Foundation: At the same time we have been dynamically downscaling these simulations for decades, to provide really high quality locally bias corrected data (using also DMI’s long climatological time series to understand if and where biases exist). Colleagues at DMI identified a need to provide this in an easy to use format to everyone in the country. We had long ago discovered that working with motivated kommune employees led to a really good outcome: readable climate variables that are meaningful to an individual city, data formats that can be used by non-scienists (who definitely can’t deal with netCDFs).
- Funding: Doing a data project properly requires money. The Climate Atlas is, compared to the cost of not doing anything, extremely cheap, nonetheless, it still costs something. Ear marked funding from the danish state to build up the Climate Atlas from the ground, to develop it as new needs are identified and to improve both communication and presentation has been crucial. Along the way several different needs have arisen (droughts, deep uncertainty in sea level rise), a new version will hopefully be coming soon.
- Intense engagement: Probably the most crucial aspect to getting the climate atlas off the ground and into use has been communication over and over and over again. Not just initially with kommune to find out what they need (building on many years of background experience first), but also reaching out to special interest groups raning from local farmers in mid-west Jylland to sewage engineers, high school teachers and property developers. This continues, but has undeniably been helped by Denmark’s open trusting society and generous tradition of cultural meetings, continuing education and festivals.
The climate atlas in Denmark is the example I know best, we should be rightly proud of the team that constructed, maintain and continue to develop it. Other countries certainly have similar products in the Nordic and Blatic countries, and likely elsewhere, a network meets annually within the region to discuss developments etc. After a coincidental meeting, DMI was also invited to help develop one for Ghana, which is ongoing, and of course, will have completely different needs and requirements, However, the decision early one to base the back end of the Climate Atlas on open tools: python, cdo, github and CORDEX simulations, makes a lot of the learnings transferable.
If you want to know more, contact my colleagues at the Klima Atlas! I’m happy to put you in touch..
*As an aside, it’s interesting how many of the climate science and policy community have moved over to Blue Sky. It was rather quiet for a while but activity seems to have picked up. I’m not abandoning mastodon, which I actually prefer, but I’m happy to see an alternative to what has become known as Birdchan. I’d urge you to try it if you’re interested in a social media presence in a slightly more appealing environment. There are a number of handy tools, including fedica, that allow you to crosspost to multiple channels at the same time (including X, mastodon, bsky, TikTok and threads) and I’m also using the OpenVibe app, which has a common timeline from multiple platforms.
https://sternaparadisaea.net/2024/09/06/a-climate-atlas-is-discovered/
#climate #climateAdaptation #climateChange #climateServices #DMI
-
Quick reminder, our group @dmidk in the national centre for climate research are hiring. A broad range of scientist and climate advisory roles available in fields covering #Africa #climateServices #RemoteSensing by #RadioOccultation and for #SeaIce
Check them out:
-
In case this weekend's posts on the lessons to take away from this summer, and the future direction of climate science and climate services have caught your interest, you might also be interested in one of the new open positions in our group at DMI - I summarise them in the post below!
#Fedijobs #AI #ML #ClimateServices #ClimateAdaptation #ClimateJobs #NWP #climateJustice
-
Musings from a hot summer: what can 2023 teach us about adaptation to #ClimateChange ?
Featuring #AMOC , #heatwave, #Antarctic #SeaIce, #SeaLevelRise, #IPCC and #ClimateServices
Some thoughts as I prepare to get back to work from the #Summer2023 break.
Features input directly lifted from @sorenhave @ZLabe @micefearboggis @rahmstorf + @EleanorFrajka @OceanTerra + @BassisJeremy
+ probably others ...http://sternaparadisaea.net/2023/07/29/musings-in-summer-2023-impacts-adaptation/
-
#ESO:
"
Ein internationales Forscherteam hat einen Doppelstern entdeckt, der Sagittarius A*, das supermassereiche Schwarze Loch im Zentrum unserer Galaxie, in geringer Entfernung umkreist. Es ist das erste Mal, dass ein Sternpaar in der Nähe eines supermassereichen Schwarzen Lochs gefunden wurde.
"
https://www.eso.org/public/germany/news/eso2418/?nolang17.12.2024
#Astronomie #Doppelstern #D9 #ERIS #Sagittarius #SchwarzesLoch #SINFONI #VLT
-

@sternentau
@rationalgarde
Toiletten! Viele ältere Menschen trinken unterwegs zu wenig, weil es in deutschen Städten und selbst an beliebten Ausflugszielen wenig bis keine öffentlichen Toiletten gibt.
#Hitzetod #Infrastruktur -

'𝗣𝗮𝗮𝗿 𝗵𝗼𝗻𝗱𝗲𝗿𝗱 𝘀𝘁𝗲𝗺𝗺𝗲𝗿𝘀 𝗻𝗼𝗱𝗶𝗴 𝗼𝗺 𝘁𝗲𝗹𝗲𝘃𝗼𝘁𝗶𝗻𝗴 𝘀𝗼𝗻𝗴𝗳𝗲𝘀𝘁𝗶𝘃𝗮𝗹 𝘁𝗲 𝘄𝗶𝗻𝗻𝗲𝗻'
Een paar honderd fanatieke stemmers hebben Israël vorig jaar de meeste publieksstemmen bezorgd. Dat schrijft The New York Times na een analyse van stemdata. De Amerikaanse krant wil hiermee laten zien hoe makkelijk de uitkomst van het songfestival te manipuleren is.
https://www.rtl.nl/nieuws/buitenland/artikel/5600722/songfestival-beinvloeding-televote-israel
-
Greenland thoughts from Antarctica..
I’m in Antarctica and yet I have been getting contact from journalists because Greenland is all over the press at the moment for all the wrong reasons. It’s reasonable I think to worry about what the various deranged threats towards Greenland will mean for us all also outside of Greenland. But I also think about (and yes, worry) about the friends I’ve made in Greenland over the years. Let’s hope common sense prevails and we can step back from the brink, and concentrate on the really long term problems that we are still rapidly storing up for ourselves.
Greenland is also on my mind, not just because of geopolitics, but also because the Copernicus Climate service has just put out their annual global climate highlights* for 2025 report with some disturbing results from Antarctica.
A few months ago we had a paper published called the Greenlandification of Antarctica, in which we argue that the changes in the Antarctic cryosphere increasingly resemble those we have previously observed in Greenland and the Arctic. To see the future of Antarctica, look at Greenland.
It’s been a busy time preparing for fieldwork and I didn’t manage to write anything here about it at the time, but this few eye-opening figure rather supports some of our arguments.
In this graphic, the 2025 temperature over the Antarctic region was 1.06°C higher than the average between 1991 and 2020 (a temperature anomaly). This is actually higher than any other region except the Arctic, where the temperature anomaly was reported to be 1.37°C above the 30 year average (bear in mind also that between 1991 and 2020, the temperature was also much increasing, so we’re not comparing with a pre-industrial climate here). Polar amplification was predicted long ago and as those first experiments found, it also is seen more in the Arctic than the Antarctic – but these results are a first hint of the amplification that is perhaps appearing now and may come to stay in the Antarctic.
In our paper we show the figure below (many thanks to illustrator Jagoba Malumbres-Olarta for the fine work), which shows five different cryosphere properties that are changing: 1) shrinking sea ice, 2) glacier velocities that show a seasonal cycle (mostly detected on the peninsula so far, though there are indications that Totten glacier for example has some kind of seasonal cycle, possibly modulated by sea ice), 3) total ice sheet mass loss, 4) ice shelf area and 5) annual mean surface temperature. In virtually all, the changes look very similar between Greenland and Antarctica, but with the crucial difference that the speed of changes is so far faster and more advanced in Greenland.
From Mottram et al., 2025: The Greenlandification of Antarctica. Original caption:
a, Commonalities include decline in sea ice extent from 1980 to 20232, with notable step-like changes in both poles. b, Seasonal glacier velocities are shown for two representative marine terminating glaciers, Kangilernata Sermia in Greenland13 and Hotine Glacier on the AP9, both now displaying similar seasonal dynamics. c, Both ice sheets show an accelerating total mass loss measured by GRACE satellites8. d, Multi-sensor records of ice shelf area loss in Antarctica11 show a steeper decline than Greenland7 as Arctic ice shelves were largely lost in the pre-satellite era. e, Satellite records of annual mean ice sheet surface (skin) temperature for 1982 to 2021 from radiation data in the CLARA-A2.1 record processed by OSISAF2 over both ice sheets. Earth observation data allows us to generalize over the vast size and spatially varying trends of the ice sheets, where there is generally poor coverage of in situ data. Individual weather stations indicate warming trends in air temperatures over both ice sheets of ~0.61 °C per decade at the South Pole and ~1.7 °C per decade at Greenland coastal stations. Illustration by Jagoba Malumbres-OlarteThe latter surface temperature plot is not the same as the Copernicus 2m air temperature which is based on the ERA5 reanalysis (so a blending of computer model with observations from satellites, weather stations, balloons, ships, planes etc). In our paper we wanted to focus on the contribution that satellite data has brought as we simply have so few direct in situ observations, so we used skin or surface temperature which is measured from satellites. It’s a somewhat theoretical construct, imagine a very thin surface (hence skin) layer, where incoming and outgoing energy are summed up to give a temperature. This is calculated over both ice sheets and sea surface by our colleagues in the satellite group at DMI and this is the dataset we used here. Their results which stretch back to the 1980s show a slow upward trend in Antarctica and a steeper change in Greenland, the record stopped in 2021 in our paper but it actually shows an upward increase since and that’s also borne out by the Copernicus results. In climate and weather models we in fact first calculate the skin temperature and then back interpolate to 2m temperature, so the two are very closely related.
To check that the satellite skin temperature record was accurate, I also looked at some of the longer in situ records, the South pole station for example has a long record and shows a small increasing trend over the last 30 years or so (which also may be attributable to natural causes, it is hard to pick out the global warming trend). Analysis of the record also shows that it is largely due to decreasing cold extremes rather than necessarily higher warm extremes. Again, a pattern we also observe in the Arctic.
Shallow snow cores drilled near Wasa, the clear layers are refrozen surface melt that has percolated into the snow below the surface. I was genuinely not expecting to see these, and it’s not always captured in the satellite record either, so we clearly have work to do to explain some of these findings.The analogy is not exact. As a continent, Antarctica is much further south than Greenland is to the north and it is much more insulated from warming by the circumpolar ocean than the Greenland ice sheet, sticking out in the middle of the Atlantic is. In a very real sense then, geography is destiny. Surface melt, which is also not nearly as common here in Antarctica mostly refreezes in the snowpack, whereas in the lower parts of Greenland it generally runs off and contributes directly to sea level rise. That has not yet become a major process in Antarctica, it’s still colder here and there is less surface melt for now, although from our own observations in the field, much more than I’d expected. Surface melt is definitely something we need to keep an eye on and some of our observations show how tricky that is, especially given disagreements between satellite sensors on this point .
But these are all details, the point is that Antarctica is also part of the global climate system and the same processes we’ve been observing for more than three decades in Greenland are now also starting to become apparent here too.
In one other respect Antarctica is becoming more similar to Greenland – it is becoming more contested. The Treaty that has governed Antarctica is vulnerable and subject to the same weakening of the global order that is now playing out in the North.
Let’s hope that geopolitics can settle down soon so that we can start to tackle the more serious and longer term crises coming down the line.
Lifted with thanks from Mackay Cartoons*I’m not sure “highlights” is quite the right word either – maybe “lowlights” would be better, but then it also starts to sound like a report on hairstyles…
#Antarctica #climate #climateChange #environment #globalWarming #Greenland #GreenlandIceSheet #iceSheet #Science
-

#ESO:
"
„Große Überraschung“: Astronomen entdecken Planeten in senkrechter Umlaufbahn um ein Sternpaar
"
".. Planeten entdeckt, der in einem Winkel von 90 Grad um ein seltenes Paar besonderer Sterne kreist. .. das erste Mal .. einen eindeutigen Beweis für einen dieser „Planeten in polarer Umlaufbahn“ .."https://www.eso.org/public/germany/news/eso2508/?nolang
16.4.2025
#2M1510 #Astronomie #BraunerZwerg #Doppelsternsystem #Exoplanet #UVES #VLT
-
Proud supervisor moment: my former PhD student and now #DMI colleague in #PRECISE_NNF project Nicolaj Hansen presenting his #Antarctic research to the Danish Meteorological Society #DAMSdk .
(I wrote about the PRECISE project here http://sternaparadisaea.net/2023/06/16/celebration-time-precise/)
-
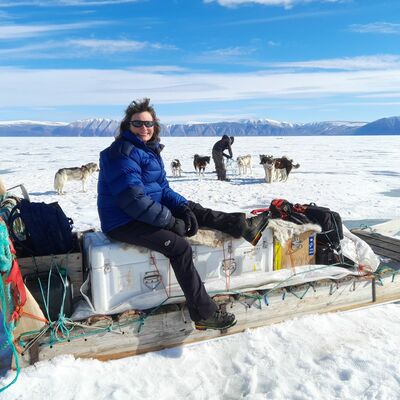
Proud supervisor moment: my former PhD student and now #DMI colleague in #PRECISE_NNF project Nicolaj Hansen presenting his #Antarctic research to the Danish Meteorological Society #DAMSdk .
(I wrote about the PRECISE project here http://sternaparadisaea.net/2023/06/16/celebration-time-precise/)
-

#job in #Waldshut-Tiengen
Revierleitung für das Revier Wutach-Steinatal (m/w/d) - Landratsamt Waldshut
https://www.greenjobs.de/a100146305 -
𝗚𝗿𝗮𝗳 𝗠𝗮𝘁𝘁𝗵𝗲𝘄 𝗣𝗲𝗿𝗿𝘆 𝗵𝗲𝗲𝗳𝘁 𝗻𝗮 𝘁𝘄𝗲𝗲 𝗷𝗮𝗮𝗿 𝗲𝗶𝗻𝗱𝗲𝗹𝗶𝗷𝗸 𝗽𝗹𝗮𝗾𝘂𝗲𝘁𝘁𝗲
Het graf van Matthew Perry in Los Angeles heeft eindelijk een plaquette gekregen waarop zijn naam en geboorte- en sterfdatum vermeld staan. Volgens Amerikaanse media werd de gedenkplaat afgelopen week opgemerkt.
-

Esattamente tre anni fa Giancarlo e Daniela stavano percorrendo la sterrata che porta a casa loro a Pomaro (poco distante da casa mia), quando trovarono un grosso cervo fermo in mezzo alla strada che li fissava inquieto.
Ok, non mi hanno parlato di eventuali richieste di stupefacenti, ma sono quasi certo che l'intenzione dell'ungulato fosse quella.
#Piozzano #cervi #colglaucoma #Pomaro #ValLuretta -
Esattamente due anni fa Giancarlo e Daniela stavano percorrendo la sterrata che porta a casa loro a Pomaro (poco distante da casa mia), quando trovarono un grosso cervo fermo in mezzo alla strada che li fissava inquieto.
Ok, non mi hanno parlato di eventuali richieste di stupefacenti, ma sono quasi certo che l'intenzione dell'ungulato fosse quella.
#Piozzano #cervi #colglaucoma #Pomaro #ValLuretta -
Today is project day at DTU-space (national space institute at the Danish Technical University), I'm not attending but my @dmidk colleagues will, recruiting MSc students for research thesis projects in the national centre for #Climate research #NCKF - if you're a university student looking for a thesis project or even just a summer internship in Denmark you can see an overview of projects I'm currently recruiting for here:
#DKmastodon #science #research #DKviden -

@sternentau Aber die Autoindustrie leidet so sehr und die Autobahnen sind doch alle Marode!
Achtung: Dieses Posting kann Spuren von Sarkasmus enthalten!
-
Thinking tonight I'll do #cornbread stuffed #porkchops with fingerling potatoes, mushroom gravy, and brussel sprouts sauteed with some bacon fat.